Service availability really matters for business goals and continual or continuous improvement. When services that a customer expects to be able to access aren’t available, that customer is going to be unhappy. It’s the unfortunate bottom line.
After all, why should the customer pay for a service that isn’t there when they need it? This, of course, is why an agreed measure of service availability is so often a key performance indicator (KPI) in IT service management (ITSM) performance metrics.
IT staff often work very hard to meet the agreed target. And they report figures to customers to prove it has been met. Typically, IT organizations use a percentage, such as 99.999% service availability, to do this.
Unfortunately, this sometimes means that IT service organizations focus on the percentage measure. And lose sight of their true goal – providing value for customers. Please keep reading to understand more, including some examples.
The trouble with percentage service availability
Organizations can view availability in real time. However, a simple service availability definition is the percentage of time your service is available. One of the simplest ways to calculate it is based on two numbers. You might remember this from your ITIL training.
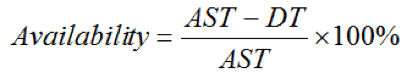
You agree on the amount of time that the service should be available over the reporting period. This is the service availability or agreed service time (AST). You measure any downtime (DT) during that period. You take the downtime away from the agreed service time, with this expressed as a percentage.
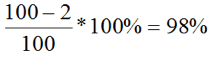
In terms of service availability examples, if AST is 100 hours and downtime is 2 hours, then the availability is:

The issues
The trouble with this is that, while this service availability calculation is easy enough to perform, and collecting the data to do it seems straightforward. It’s really not at all clear what the number you end up with is actually telling you. I’ll go into a bit more detail about this later in the blog.
Worse still, from the customer’s point of view, you may be reporting that you have met agreed service availability goals. But the customer is totally unsatisfied with the user experience or customer experience (internal and external customer satisfaction).
Customers are only interested in percentage service availability insofar as it correctly identifies their ability to use IT services to support business processes. A blanket percentage figure is probably not going to do that. A meaningful report needs to be based on measurements that describe things the customer cares about. For example, the ability to send and receive emails, or to withdraw cash from ATMs.
Defining service availability targets
If you want to measure, document, and report service availability in ways that will be helpful to your organization and customers you need to do two things. Firstly, you need to understand the context. To do this you’ll need to talk to your customers.
Secondly, you need to think very carefully about a range of practical issues. What will you measure, how will you collect your data, and how will you document and report your service availability findings?
Talking to customers
Before you do anything else, you need to work out what your customers need service availability for. And what impact the loss of service availability has on them. This will allow you to agree realistic goals that consider technology (perhaps even specific configuration items), budgetary, and staffing constraints.
In other words, you need to talk to your customers to ensure you understand what they need in terms of service availability. And if necessary, to help them understand that “I want it to be available all the time” is probably going to cost more than it’s worth.
But what exactly should you be talking to your customers about? An excellent starting point is the impact of downtime. Here are five service availability questions you should consider asking:
- Which of your business functions are so critical that protecting them from downtime is a priority?
- How does the length of any downtime affect your business?
- How does the frequency of downtime affect your business?
- What impact do service availability and downtime have on your organization’s productivity and customers?
Critical business functions
Most IT services support several business processes. Some of these are critical and others are less important in service availability terms. For example, an ATM may support cash dispensing and statement printing. The ability to dispense cash is critical, but if the ATM can’t print statements this has a much lower impact.
You need to talk to your customers about service availability and reach an agreement on the importance of the various functions to their business. You may find it helpful to draw up a table that indicates the business impact that follows losing each of these functions relative to one another. Table 1 is an example:
Table 1 – Percentage degradation of service
| IT function that is not available | % degradation of service |
|---|---|
| Sending email | 100% |
| Receiving email | 100% |
| Reading public folders | 50% |
| Updating public folders | 10% |
| Accessing shared calendars | 30% |
| Updating shared calendars | 10% |
NB: Figures are not intended to add up to 100%
It’s clear from this table that the service has no value at all if it cannot send and receive emails. And that the value of the service is reduced to half its normal level if public folders cannot be read. This tells the IT organization where to focus their service availability efforts when designing and managing the email service.
Duration and frequency of downtime
You need to find out how the customer’s business is affected by both the frequency and the duration of downtime. I’ve already mentioned that percentage service availability may not tell you enough to be of value.
When a service that should be available for 100 hours has 98% service availability, there were two hours of downtime. But this could mean a single two-hour incident, or many shorter incidents. The relative service availability impact of a single long incident or many shorter incidents will be different, depending on the nature of the business and the business processes involved.
For example, a billing run that takes two days to complete and must be restarted after any outage will have its service availability seriously impacted by every short outage. But one outage that lasts a long time may be less significant. On the other hand, a web-based shopping site may not be impacted by a one-minute outage. But after two hours the loss of customers could be significant.
Once you know the likely impact, you’re in a much better position to:
- Put in place infrastructure, applications, and processes that will really support the customer
- Devise meaningful targets
- Find ways of documenting and reporting the service availability appropriately.
Here’s an example of how you could measure service availability to reflect the fact that the impact of downtime varies:
Table 2 – Outage duration and maximum frequency
| Outage duration | Maximum frequency |
|---|---|
| Up to 2 minutes | 2 events per hour 5 events per day 10 events per week |
| 2 minutes to 30 minutes | 2 events per week 6 events per quarter |
| 30 minutes to 4 hours | 4 events per year |
| 4 hours to 8 hours | 1 event per year |
If you use a table like this when you’re discussing the frequency and duration of downtime with your customers, the numbers are likely to be much more useful than percentage service availability, and they’ll certainly be more meaningful to your customers.
Downtime and productivity
I’ve said that percentage service availability is not very useful for talking to customers about downtime. In contrast, when you discuss the impact of downtime on productivity, percentage impact can be a very useful measure indeed.
Most incidents don’t cause complete loss of service for all users. Some users may be unaffected, while others have no service at all.
At one extreme, there may be a single user with a faulty PC who cannot access any services. You might class this as 100% loss of service. But this would leave IT with a totally unrealistic goal, and would not be a fair measurement of service availability.
At the opposite extreme, you might decide to say that a service is available so long as someone can still access it. However, you don’t need much imagination to understand how customers would feel if service availability is being reported while many people just can’t access it.
An example
One way you can quantify service availability impact is to calculate the percentage of user minutes that were lost. To do this:
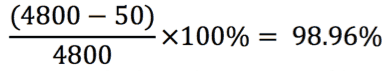
- Calculate the PotentialUserMinutes. This is the total number of users times the length of time that they work. For example, if you have 10 staff who work for 8 hours then the PotentialUserMinutes is 10 x 8 x 60 = 4800
- Calculate the UserOutageMinutes. This is the total number of users who were not able to work, multiplied by the time they were unable to work. For example, if an incident prevented 5 people from working for 10 minutes then the UserOutageMinutes is 50.
- Calculate the percentage service availability using a very similar formula to the one we saw earlier

In this example, you would calculate the service availability as:
You can use this same technique to calculate the impact of lost service availability of IP telephony in a call center in terms of PotentialAgentPhoneMinutes and LostAgentPhoneMinutes. For applications that deal with transactions or manufacturing, you can use a similar approach to quantify the business impact of an incident. You compare the number of transactions that would have been expected without downtime to the number of actual transactions. Or the amount of production that you would have predicted to the actual production.
Measuring and reporting service availability
After you’ve agreed and documented your service availability targets, you need to think about practical aspects of measuring and reporting availability. For example:
- What will you measure?
- How will you collect your service availability data?
- How will you document and report your findings?
Service availability metrics: what to measure
It’s essential to measure and report service availability in terms that can be compared to targets agreed with customers. And that are based on a shared understanding of what the customer’s service availability needs actually are. The targets need to make sense to the customer, and to ensure that the IT organization’s efforts are focused on the customer’s business needs.
Usually, the targets will form part of a service level agreement (SLA) between the IT organization and the customer. But be careful that meeting numbers in an SLA does not become your goal.
The numbers in the SLA are simply agreed ways of measuring. The real goal is to deliver services that meet your customers’ needs (and this includes service availability). For example, with IT self-service.
How to collect your service availability data
There are many different ways that you could collect data about service availability. Some of these are simple, but not very accurate, others are more expensive. You may want to focus on just one approach, or you may need to combine some of these to generate your reports.
Collecting service availability data at the service desk
One way to collect service availability data is via the service desk. Service desk staff identify the business impact and duration of each incident as a routine part of managing incidents. You can use this data to identify the duration of incidents and the number of users impacted.
This approach is generally fairly inexpensive. However, it can lead to disputes about the accuracy of the service availability data.
Measuring the service availability of infrastructure and applications
This approach involves instrumenting all the components required to deliver the service and calculating service availability based on understanding how each component contributes to the end-to-end service.
This can be very effective, but may miss subtle failures, for example a minor database corruption could result in some users being unable to submit particular types of transaction. This service availability method can also miss the impact of shared components, for example one of my customers had regular downtime for their email service due to unreliable DHCP servers in their HQ, but the IT organization did not register this as email downtime in their calculation.
Using dummy clients
Some organizations use dummy clients to submit known transactions from particular points on the network to check whether the service is functioning. This does actually measure end-to-end service availability.
Depending on the size and complexity of the network this can be quite expensive to implement, and it can only report the service availability from the particular dummy clients. This means that subtle failures may be missed, for example if a change means that clients running a particular web browser no longer work correctly, but the dummy clients use a different browser.
Tools that support this data collection often report service performance, as well as service availability, and this can be a useful addition.
Instrumenting applications
Some organizations include code in their applications to report end-to-end service availability. This can actually measure end-to-end service availability, provided that the requirement is included early in the application design. Typically, this will include code in the client application as well as on the servers.
When this is done well it can not only collect end-to-end service availability data, but it can also identify exactly where a failure has occurred, helping to improve availability by reducing the time needed to resolve incidents.
How to document and report your service availability findings
When you have collected service availability data, you need to consider how this should be reported to customers.
Plan your downtime
One aspect of service availability measurement and reporting that’s often overlooked is planned downtime. If you forget to factor in planned downtime when you’re working out how to report service availability, you could end up reporting availability figures that don’t fairly reflect your service provision.
There are several ways to make sure that planned downtime doesn’t accidentally end up inflating the service availability statistics. One is to have the planned downtime happen during a specific window that’s not included in availability calculations. Another is to schedule planned downtime. For example, some organizations may not count downtime that has been scheduled a month in advance.
Whatever you decide to do with service availability, it’s important that your SLA clearly defines how planned downtime will be reported for management systems.
Agree on your service availability reporting period
Earlier in this blog, I talked about the limitations of percentage service availability as a useful measure. Nevertheless, it does have its uses and it continues to be widely used. So, it’s important to understand that you need to specify the time period over which calculation and reporting take place, as this can have a dramatic effect on the service availability numbers that you’ll be reporting.
For example, let’s consider an IT organization that has agreed a 24×7 service and service availability of 99%. Suppose there’s an eight-hour outage:
- If we report service availability every week then the AST (Agreed Service Time) is 24 x 7 hours = 168 hours
- Measured monthly the AST is (24 x 365) / 12 = 730 hours
- Measured quarterly the AST is (24 x 365) / 4 = 2190 hours
Putting these numbers into the availability equation gives:
- Weekly service availability = 100% x (168 – 8) / 168 = 95.2%.
- Monthly service availability = 100% x (730 – 8) / 730 = 98.9%
- Quarterly service availability = 100% x (2190 – 8) / 2190 = 99.6%
Each of these is a valid figure for service availability, but only one of them shows that the target was met.
And finally
Almost every IT organization that I’ve worked with measures and reports service availability. The really great IT departments work with their customers to optimize their investment and deliver levels of service availability that delight. Sadly, many IT organizations focus on the numbers in an SLA, and completely fail to meet their customers’ needs – even if they deliver the agreed numbers.
In this article, I’ve offered a number of suggestions for how you can measure and report service availability, but I haven’t discussed what you can do to help manage and improve it. This is probably even more important, but it’s a topic for another article. As is disaster recovery planning!
What else would you add to my service availability advice? Where do you need help, perhaps with service delivery? Please comment below.
Stuart originally wrote this service availability article in 2017 with it updated in 2025.
If you liked this service availability article, then the following ITSM articles might be helpful too:
If you can’t find anything helpful here, please use the site’s search capability to find more interesting ITSM articles on topics such as ITSM processes, emerging information technologies, asset management, email address management, user-friendly UI design, unplanned downtime, high-level performance metrics, mobile app management, configuration manager responsibilities, ITSM tools, email account management, reducing human error with automation, reducing lost productivity, and long-term service level management.